This report presents the results of the 11th annual FSB monitoring exercise to assess trends and vulnerabilities in NBFI, covering 29 jurisdictions that account for approximately 80% of global GDP.
The report covers NBFI developments for the year ending 31 December 2020, a period that includes both the COVID-19 shock and the extraordinary steps taken by official sector authorities to stabilise financial markets and support financing to the real economy.
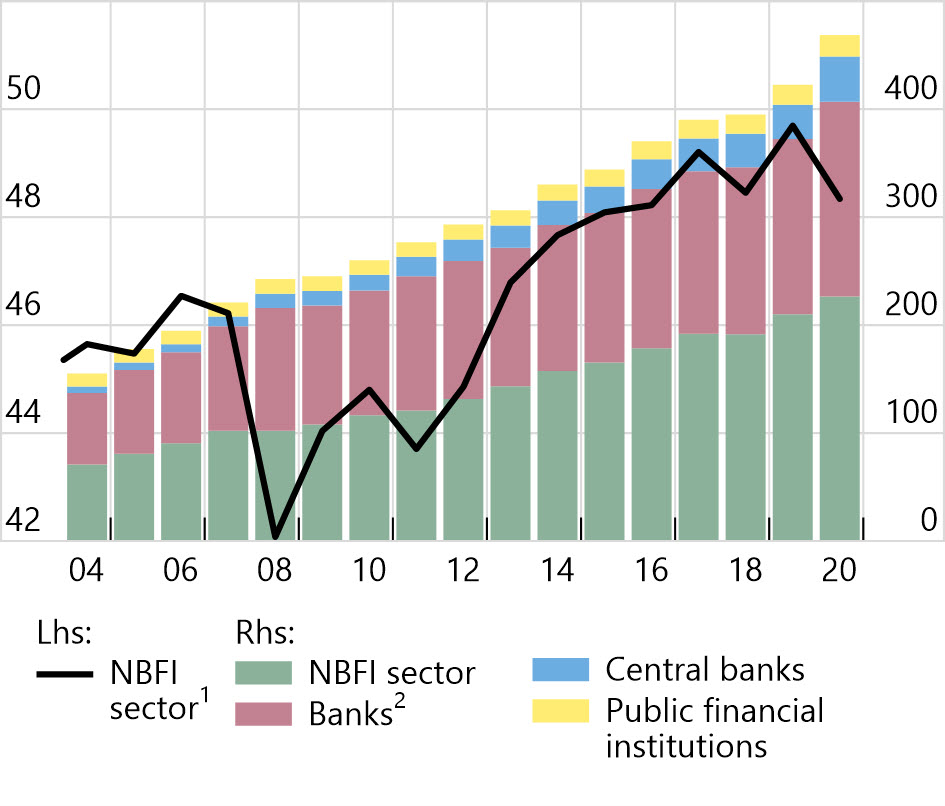
Total global financial assets exhibited strong growth in 2020, increasing by 10.9% to $468.7 trillion. This was faster than the global NBFI sector, comprising mainly pension funds, insurance corporations and other financial intermediaries (OFIs)1, which experienced asset growth of 7.9%, reaching $226.6 trillion. The faster growth in bank, central bank, and public financial institution assets than NBFI sector assets is partly attributable to the COVID-19 pandemic, when accommodative official sector responses supported the real economy, including through the banking system.
The NBFI sector’s relative share of total global financial assets therefore decreased from 49.7% to 48.3% in 2020. This was the largest percentage point decrease since the 2008 financial crisis. In particular, asset growth in the NBFI sector was lower than that of central banks (32.3%), and banks (11.1%).
Similar to 2019, NBFI sector growth in 2020 was mainly driven by investment funds, insurance corporations, and pension funds. Growth in investment fund assets was supported by a combination of flows and valuation effects.
Credit intermediation by the NBFI sector increased more slowly than credit intermediation by the banking sector. In 2020, banks’ credit assets grew by 10.5%, a faster pace than credit assets held by insurance corporations (6.4%), pension funds (7.9%) and OFIs (4.6%).
Interconnectedness between banks and the NBFI sector decreased slightly in 2020. Financial interconnectedness is a feature of an open and integrated global financial system. It may help share risk across financial sectors but may also serve as a channel for risk transmission, particularly when entities along intermediation chains employ a high degree of leverage or engage in maturity/liquidity transformation. Therefore, measures of interconnectedness among banks, OFIs, and other non-bank financial entities can serve as important indicators of potential contagion, within and across borders.
The narrow measure of NBFI grew by 7.4% to $63.2 trillion in 2020, at a pace similar to the 2014-19 annual growth rate of 7.3%. At end-2020 it therefore represents 27.9% of total NBFI assets, and 13.7% of total global financial assets. Since the 2008 financial crisis, growth of the narrow measure has been driven primarily by investment funds.
The narrow measure, which reflects an activity-based “economic function” (EF) assessment of risks, includes the following elements:
Collective investment vehicles with features that make them susceptible to runs (EF1) grew by 9.0% in 2020, remaining by far the largest component of the narrow measure with a share of 75.1%. Although investment funds experienced significant outflows in Q1 2020, the prompt recovery in the subsequent two quarters meant they remained the largest contributor to narrow measure growth.
Loan provision that is typically dependent on short-term funding (EF2) grew by 4.2% in 2020, representing 6.7% of the narrow measure. Measures of leverage for finance companies, the entity type most prevalent in EF2, remained stable.
Intermediation of market activities dependent on short-term funding (EF3) grew by 3.7% in 2020, representing 7.8% of the narrow measure. Growth in 2020 was driven, in broadly equal measure, by broker-dealers and custodial accounts, the two main entities classified into EF3.
After strong growth in 2019 (4.5%), insurance or guarantees of financial products (EF4) only grew by 0.4% in 2020. Financial assets associated with these activities still constitute less than 1% of the narrow measure.
Securitisation-based credit intermediation (EF5) shrank by 4.0% in 2020, as assets of Chinese trust companies continued to decrease. EF5 now accounts for 7.5% of the narrow measure.
Assets that are unallocated between the five EFs represent 2.6% of the narrow measure.
Datasets from the report are publicly available for use in accordance with the FSB’s normal terms and conditions.
- OFIs include all financial intermediaries that are not central banks, banks, public financial institutions, insurance corporations, pension funds or financial auxiliaries. They include mainly investment funds, captive financial institutions and money lenders, central counterparties, broker-dealers, finance companies, trust companies and structured finance vehicles. [←]